FinTech & MedTech:
Healthcare Invoicing Dashboard Case Study
Overview
Brief:
My task is to identify and develop additional features and USPs (Unique Selling Propositions) and to provide a summarised approach with an overview of Wireframe.
Role:
Senior UX/UI Designer
Design Process:
Market Research & Analysis, User Feedback, Synthesising Data, Information Architecture, User Flow, Wireframing
I started by diving into a market analysis because understanding the competitive landscape and industry trends is crucial.
It's like peeling back the layers of an onion, getting to the core of what makes the market tick. You've got to know what's out there, what's working, and what's missing.
So, I rolled up my sleeves and dug deep, scouring through industry reports, studying competitor strategies, and keeping a close eye on consumer behavior. It was like detective work, piecing together clues to uncover hidden opportunities. The goal:
Identify key competitors and analyze their products/services
Research industry trends, market size, and target audience demographics.
Gather data on user preferences, pain points, and behaviors through surveys, interviews, or analytics tools.
Analyze the collected data to uncover insights and opportunities for product improvement and differentiation.

Then came the fun part—connecting with real people.
I chatted with potential customers, listened to their stories, and learned about their pain points. It was eye-opening to hear directly from end users.
Their insights were gold, giving me a roadmap for how to tailor our product to meet their needs. Here’s how I did it:
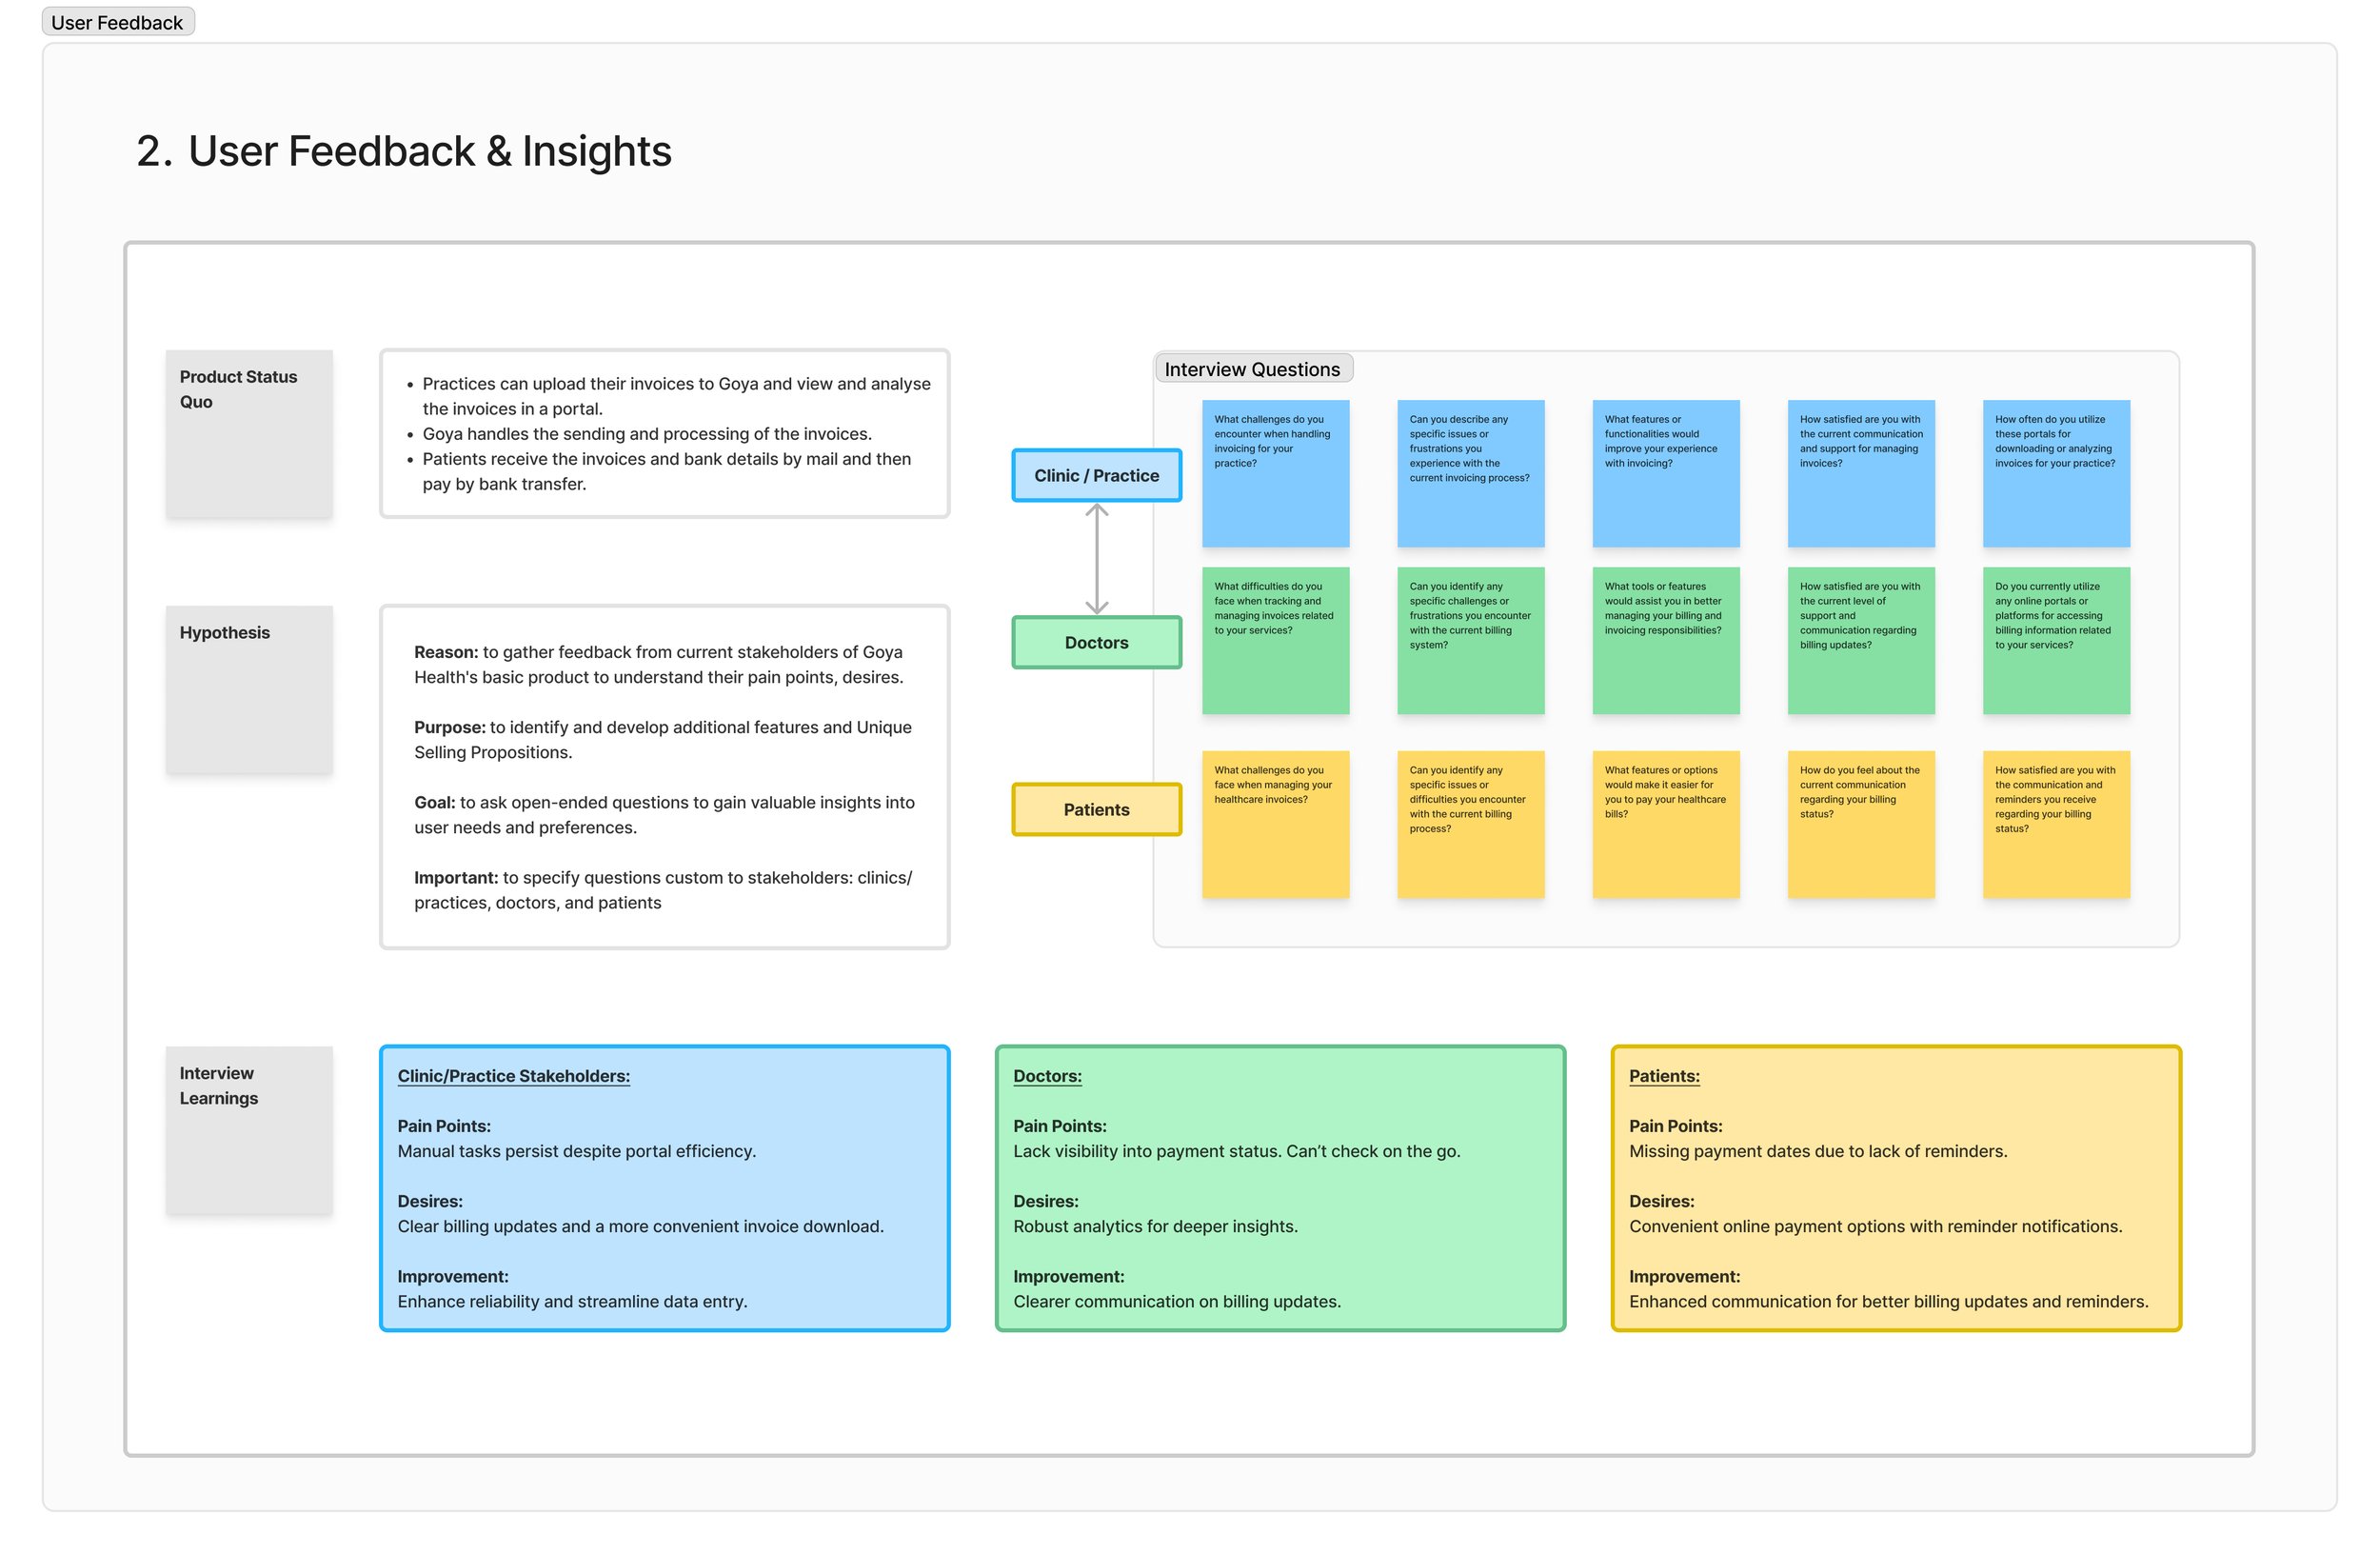
Collect user feedback through surveys, interviews
Analyze the feedback to identify common themes, patterns, and areas for improvement
Prioritize feedback based on relevance and impact on the product's usability and user experience
Use the feedback to inform decision-making and guide the development of additional features and USP
As I immersed myself in the market landscape, certain patterns started to emerge.
It was like putting together a puzzle, seeing where the pieces fit and where there were gaps. That's when the lightbulb moments happened, and I began to see opportunities for innovation and differentiation.
This is how I synthesize data:
Gather data from various sources, including market research, user feedback, and analytics.
Organize the data into relevant categories and themes.
Analyze the data to identify patterns, trends, and user preferences.
Synthesize the findings to derive actionable insights that guide the development of additional features and USPs.

Loaded with data from previous steps, I identified entry points and success criteria and focused on building IA through a flowchart.
This step is crucial because it lays the foundation for a user-friendly and efficient digital product.
It guided my development, ensuring each feature had a purpose. These are the steps I took to reach it:
Identify key user tasks and goals.
Map out the sequence of steps users will take to complete each task.
Define entry points, decision points, and exit points within the user flow.
Optimize the user flow to minimize friction and streamline the user experience.
Validate the user flow through usability testing and iterate based on feedback.


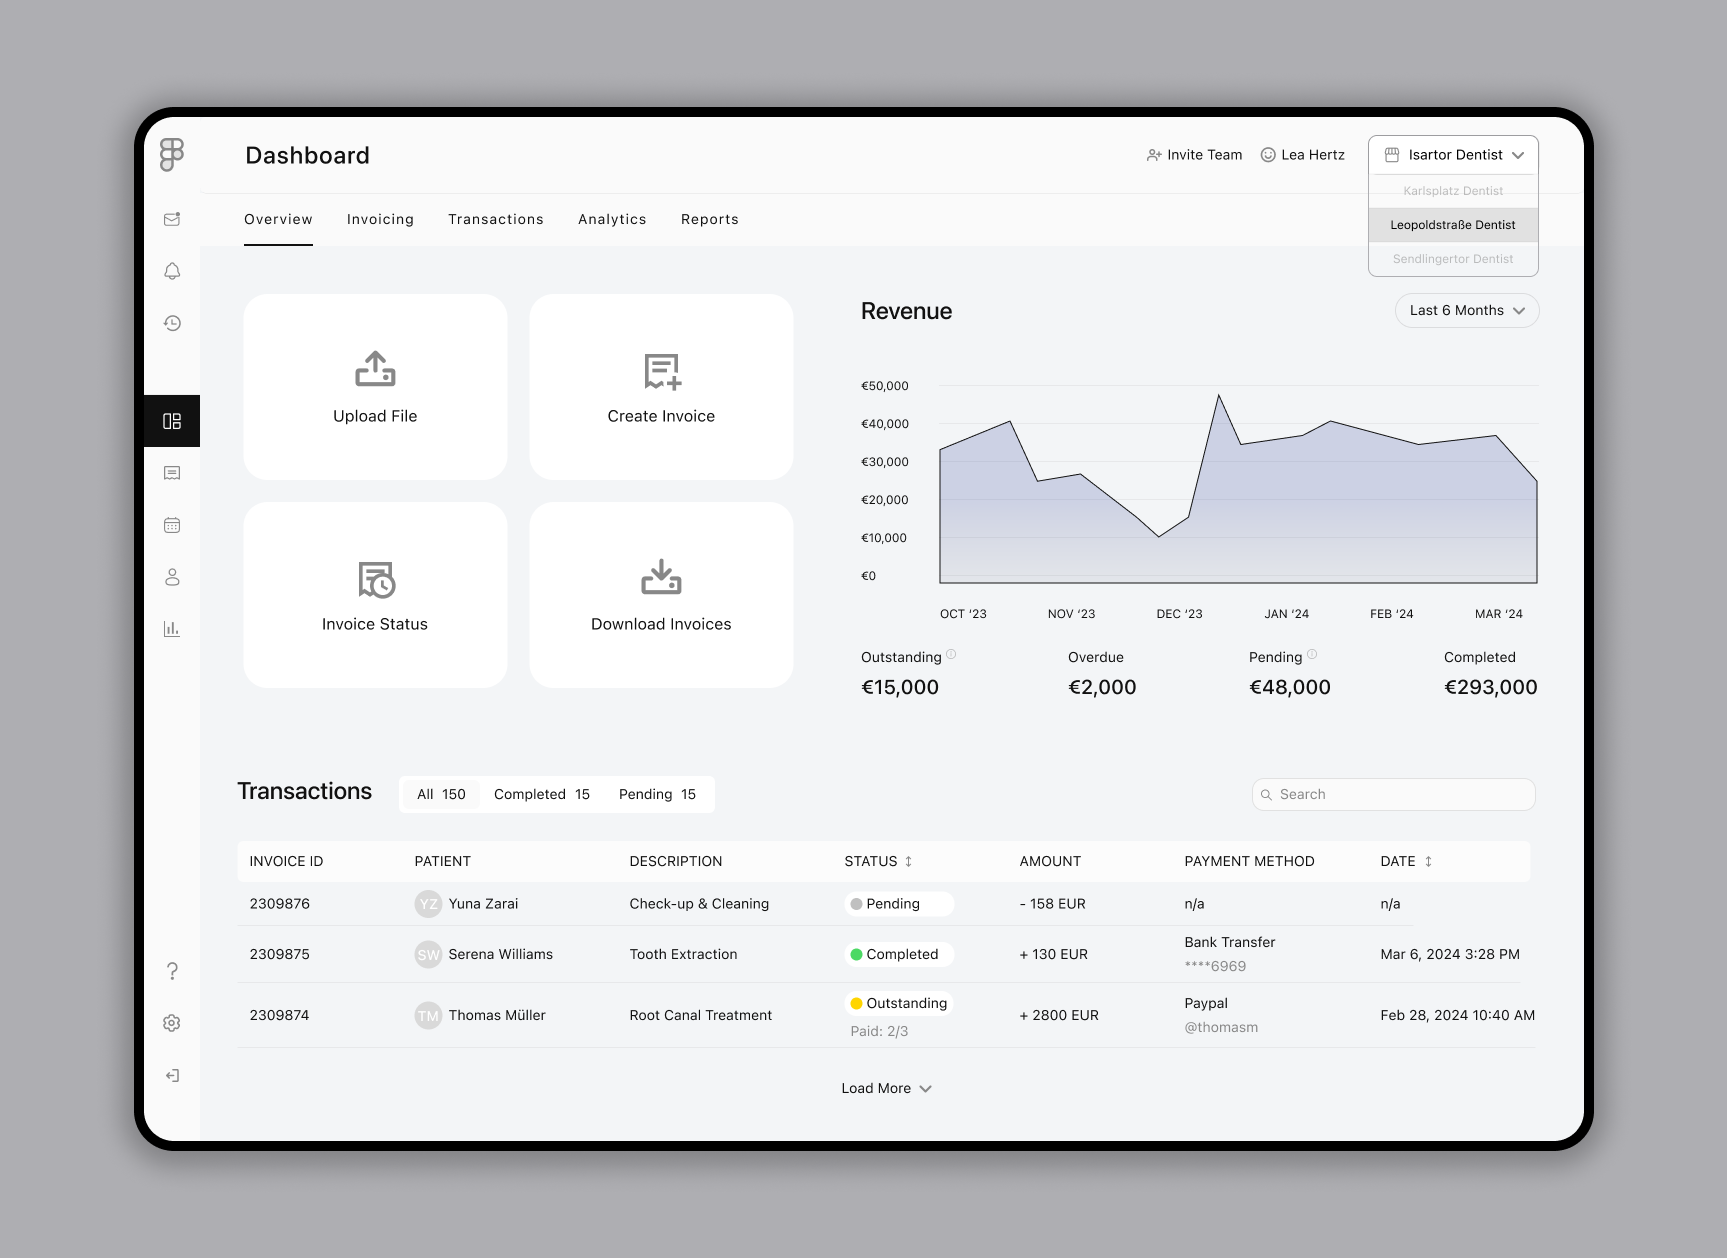
But ideas are just the beginning. I needed to bring the vision to life, and that's where wireframing and prototyping came in.
I sketched out rough outlines of the product, mapping out user flows and interactions. It was like building the skeleton of a house, laying the foundation for what was to come.
With wireframes in hand, I moved on to prototyping, creating interactive mockups that gave a taste of what the final product would look and feel like. It was a chance to test the ideas in the real world, gathering feedback and making adjustments along the way. Let me break down the steps I took:
Sketch out rough wireframe layouts based on the information architecture and user flow.
Focus on layout, content placement, and interaction design rather than visual aesthetics.
Iterate the wireframes based on feedback from stakeholders and usability testing.
Annotate the wireframes to provide additional context and explanation for stakeholders and developers.
Use the wireframes as a blueprint for further design and development iterations.


Looking back, that initial market analysis wasn't just a box to check off—it was the compass that guided me through the twists and turns of the market, helping me navigate with confidence and clarity.
And as I continue to grow and evolve, it's a reminder of the power of understanding your market inside and out. It serves as a constant reminder of the importance of staying attuned to market dynamics, trends, and consumer behavior. —it's an ongoing journey of learning and adaptation.